


Introduction: Why Measuring ROI Of AI Training Is Now A Board-Level Imperative
The first time I watched a leadership team roll out AI training, it felt like watching a new engine get bolted onto an old car. The technology was powerful, the enthusiasm was real, and yet three months later the CFO was asking a simple question that froze the room: “What did we get for this spend?” Research on the return on investment of intelligent automation shows this question is becoming universal across industries as organizations seek to justify AI expenditures. The technology was powerful, the enthusiasm was real, and yet three months later the CFO was asking a simple question that froze the room: “What did we get for this spend?” That moment is exactly where measuring ROI of AI training either earns a budget for next year—or gets quietly cut.
AI training does not just give people more information. It changes how they design workflows, make decisions, and use automation every single day. That means normal learning metrics like enrollments, completions, or smile sheets barely touch the real value created. When I talk with HR Directors, CLOs, CIOs, and business leaders, the pain is clear. Budgets for AI tools and training are rising, economic pressure is intense, and vague stories about “learning impact” no longer calm a finance team that lives in EBITDA, cash flow, and risk.
This is why measuring ROI of AI training needs a different lens. AI capability shows up in three time windows: early adoption and behavior signals in the first 0–6 months, operational efficiency between 6–18 months, and deeper business and strategic outcomes over 12–36 months. It also moves through three layers of measurement: learning and adoption, operational KPIs, and full business outcomes. At the center of all three sit productivity and workflow redesign—but those gains only stick when leaders change how they run teams and use AI.
With iAvva AI, I have leaned into this reality. The platform is built as an AI-powered leadership development and coaching system that lines up daily habits with OKRs, then surfaces analytics that connect “soft” growth to hard numbers. In this article, I will walk through a practical playbook for building a CFO-ready ROI model, show how to adapt it for different types of AI training, and explain how platforms like iAvva AI make that measurement more reliable and less painful. By the end, you will have a clear structure, concrete formulas, and a 90‑day roadmap to start measuring ROI with confidence.
“What gets measured gets managed.” – Peter Drucker
Key Takeaways
- Measuring ROI of AI training only works when I focus on productivity, workflow redesign, and leadership behavior instead of stopping at quiz scores and completion rates.
- I can organize my measurement with a 3×3 architecture: three time horizons (0–6, 6–18, 12–36 months) crossed with three layers (learning and adoption, operational efficiency, strategic outcomes).
- Simple but solid formulas, especially productivity-based models that convert hours saved into dollar value, help me speak the language of CFOs and boards.
- ROI looks different for generative AI skills, automation and agentic skills, and foundational AI literacy and leadership, so I need tailored KPIs for each.
- Leadership is the hinge: without AI-ready, reflective leaders, the time savings from AI training often disappear into busywork instead of higher-value output.
- iAvva AI’s Coach app and analytics let me tie leadership reflection and behavior change directly to OKRs and team KPIs, turning soft data into a clearer ROI story.
- A phased roadmap—baseline and pilot, then operationalization, then enterprise integration—gives me a practical way to start small and scale what works.
- With a focused 90‑day plan, I can begin measuring ROI on one or two workflows, gather baseline data, and build early wins that keep executives engaged.
What Makes Measuring ROI Of AI Training Fundamentally Different?
When I measure the impact of a traditional course, I usually look at what people learned and how they felt. With AI training, that is not enough. The real test is whether teams rebuild how they work. AI does not only add a skill; it changes task decomposition, automates steps that were manual, and shifts who makes which decisions. That shift means ROI lives in the structure of work, not only inside someone’s head.
AI capability also spreads across a company in ways classic training does not. When one operations team designs a strong AI workflow, another function often copies it. A single leader who models smart AI use can influence dozens of people. These network and spillover effects mean the value of AI training often shows up far beyond the original learner group, which makes one simple ROI number feel thin. I have found it more useful to think in portfolios of value than in a single point estimate.
The time window is different as well. Real productivity gains from AI usually stabilize over 12–24 months, and the more strategic effects—innovation, customer experience, risk posture—take 12–36 months to show clearly. Recent research suggests that measuring the ROI of AI requires looking beyond traditional metrics to capture this extended value-creation timeline. Real productivity gains from AI usually stabilize over 12–24 months, and the more strategic effects—innovation, customer experience, risk posture—take 12–36 months to show clearly. If I try to call the ROI verdict after one quarter, I almost always under-report the impact. Finally, AI is unusual because it is both the subject of the training and the tool I can use to measure that training’s effect. When I connect AI coaching, usage data, and operational systems, I can see patterns no manual dashboard would surface.
Why Traditional Training Metrics Break Down For AI
Most learning teams, including mine in past roles, start with a familiar set of numbers. I track completions, satisfaction scores, quiz results, and seat time. These tell me whether people showed up and whether the content made sense. With AI training, those metrics still matter, but they fail as the main story. They talk about attention, not application.
A group can complete every module, give glowing NPS feedback, and still never change how they write proposals, debug code, or respond to customers with AI. There is no line from those numbers to output per FTE, automation levels, or decision quality. When a CFO asks how the program changed EBITDA or cash, quoting completion rates only frustrates them. I have learned to treat these traditional metrics as necessary early signals, never as proof of ROI.
I often imagine a team that hit 100 percent completion on an AI course yet still writes every email, report, and ticket response the old way. On paper, the program looks like a success. In practice, nothing about cost, risk, or revenue changed. That gap is why measuring ROI of AI training forces me to go further and look directly at work, performance, and leadership behavior.
How AI Training Changes Workflows, Decisions, And Culture
To see the true ROI of AI training, I have to watch how people redesign their day-to-day work. Powerful programs teach task decomposition first: how to break a complex activity into AI-friendly parts, where to let a model draft content, where to insert checks, and where humans must stay in charge. Over time, teams turn ad hoc usage into stable workflows.
The same training shifts decision-making. Leaders who know how to frame better questions for AI, run quick scenario tests, and check bias make choices faster and with more confidence. In customer service, that might mean AI triage and knowledge retrieval that cut handle time and reduce escalations. In HR, it might look like AI-supported talent analytics that shorten time-to-fill while improving the match between candidates and roles.
Culture moves as well. When leaders treat AI as a co‑pilot instead of a threat, people experiment more, share prompts, and co-create use cases across functions. That cultural stance becomes one of the largest ROI drivers. So my measurement cannot stop at tool usage logs. I also need:
- Process indicators – updated SOPs that include AI steps, new checklists, revised RACI charts.
- Behavioral indicators – how leaders talk about AI, how they allocate time, and how often they encourage AI-augmented approaches.
“Culture eats strategy for breakfast.” – Peter Drucker
For AI training, culture determines whether new skills become real performance gains.
The Stakeholders Who Care About AI Training ROI (And What They Need To See)
Whenever I build an ROI story, I remind myself that “ROI” means different things to different people. A CFO looks for EBITDA shifts, cash impact, and risk. HR cares about engagement, retention, and internal mobility. CIOs want safe, governed use instead of shadow tools. Business unit leaders focus on throughput and revenue. If I speak to all of them with one generic deck, misalignment is almost guaranteed.
I find it helpful to map this explicitly in a simple table.
| Stakeholder | What “ROI” Mainly Means To Them | Example Questions They Ask |
|---|---|---|
| CFO / Finance | EBITDA, cash flow, total cost of ownership, risk | How does this change margin and risk over 1–3 years? |
| CEO / C‑Suite | Competitive edge, innovation, resilience | Does this make us faster and safer than peers? |
| HR / L&D / People Ops | Engagement, retention, internal mobility, culture | Are people staying, growing, and using AI well? |
| CIO / IT Leaders | Adoption of approved tools, security, support load | Are we using AI safely without overloading IT? |
| Business Unit Leaders | Throughput, revenue, error rates | Do my teams ship more, better work with the same or less cost? |
| Individual Professionals | Time saved, recognition, career resilience | How does this help my performance and growth? |
When I ignore these differences, I often see friction—HR talking about “learning impact,” while finance waits for P&L numbers. A shared framework helps. Platforms like iAvva AI can support this by giving each group a tailored view: HR gets engagement and growth trends, business leaders see links to team KPIs, and the C‑suite sees how leadership behavior connects to strategic outcomes.
A 3×3 Architecture For Measuring ROI Of AI Training
Over time, I have settled on a simple way to structure measuring ROI of AI training: a 3×3 matrix that crosses time horizons with measurement layers. This keeps expectations realistic and stops everyone from judging the entire program on a single quarterly number.
The three time horizons follow how AI value usually unfolds:
- 0–6 months – leading indicators: adoption of AI tools, changes in behavior, and basic proficiency.
- 6–18 months – operational metrics: hours saved, cycle times, automation rates, and error reductions.
- 12–36 months – big business outcomes: revenue shifts, innovation speed, customer satisfaction, and risk.
On the other axis sit three layers of measurement:
- Learning and adoption – did people use the training, and are they applying AI?
- Operational efficiency – did key workflows become faster, cheaper, and more reliable?
- Business and strategic outcomes – did those changes matter for growth, margin, customer loyalty, and resilience?
When I map programs into this architecture, I can answer a hard question from the board: “What can you show us this quarter, and what will take another year?”
Time Horizons: From Early Signals To Strategic Outcomes
When I set expectations on measuring ROI of AI training, I always walk leaders through the three time horizons with concrete examples.
0–6 Months: Early Signals
- AI tool adoption rate (weekly active usage).
- Time-to-first AI-assisted task.
- Cross-functional AI projects started.
- Senior leaders actively involved in AI learning and sponsorship.
6–18 Months: Operational Efficiency
- Hours per task before vs after AI training.
- Output per FTE in targeted workflows.
- Error and rework rates.
- Automation levels and time-to-complete for key processes (for example, onboarding or report generation).
12–36 Months: Strategic Outcomes
- Revenue lift from AI-accelerated campaigns or products.
- Innovation velocity: experiments, features, and products shipped.
- Customer metrics such as NPS, CSAT, and churn.
- Risk and compliance incident trends.
If I try to declare ROI after only one quarter, I almost always underestimate the effect. Setting these horizons from the start calms stakeholders and gives a realistic glide path.
Three Layers Of Measurement For AI Training ROI
Across those time horizons, I structure my metrics into three layers so I do not confuse learning signals with business results.
- Learning And Adoption
- Core question: Are people absorbing and applying AI skills?
- Data sources: LMS data, engagement with iAvva AI Coach, skill assessments, AI platform usage logs.
- Examples: completion rates, assessment scores, number of AI-augmented tasks completed, frequency of AI reflection.
- Operational Efficiency
- Core question: Did the work itself get better?
- Data sources: CRM, ticketing, ERP, HRIS, process mining, time studies.
- Examples: cycle time, throughput per FTE, hours saved, error and rework reductions.
- Business And Strategic Outcomes
- Core question: Did this matter for the business?
- Data sources: financial systems, customer analytics, risk and compliance reports, market data.
- Examples: revenue and margin impact, innovation pipeline, customer loyalty, risk posture.
A company-wide AI literacy program, for example, might first show up as more AI use cases proposed (layer one), then as faster workflows (layer two), and finally as more new features shipped per quarter (layer three). Structuring data this way helps me show a clear chain from training to outcomes.
Core Formulas And Financial Models For Measuring ROI Of AI Training
Once the structure is clear, I move to numbers that finance leaders trust. At its core, measuring ROI of AI training still uses the classic training ROI formula, but I plug in AI-specific benefits and costs. The key is to be both simple and honest: include all major costs, avoid inflated benefit estimates, and clearly separate hard from soft value.
For AI programs, I lean on productivity-based models. They start with time savings. I ask how long a task took before AI-supported workflows, how long it takes now, how many people perform it, and how often they do it. That gives me hours saved. Then I convert those hours into dollar value using fully loaded cost per hour. Finally, I compare the total value to all program costs, including platform fees, design, facilitation, employee time, and change management work.
Foundational ROI Formula Every CFO Expects
Finance leaders expect me to start with a familiar structure. I use this simple formula:
Training ROI (%) = (Net Program Benefits ÷ Program Costs) × 100
In an AI context, Net Program Benefits combine several elements. I count:
- Productivity gains from hours saved.
- Revenue gains from higher output or better conversion.
- Cost savings such as lower vendor spend or reduced overtime.
- Risk reduction value from fewer incidents or errors where a cost is known.
From that total, I subtract all Program Costs, including:
- Platform and license fees.
- Content development and facilitation (internal and external).
- Opportunity cost of learner time.
- Program management, communication, change support.
- IT and security enablement.
Example: an AI training program costs $200,000 all‑in and delivers $300,000 in combined productivity and cost savings in year one. Net Program Benefits are $100,000, and ROI is (100,000 ÷ 200,000) × 100 = 50%. That is a modest, credible number—far more believable than a claim that ignores the cost of learner time.
Productivity-Based Formula For AI Training ROI
Because AI changes time and effort so directly, I often switch to a more specific productivity formula:
ROI (%) = [(Hours Saved × Average Hourly Value) ÷ Total AI Training Costs] × 100
Where:
- Hours Saved = (Baseline time per task – Post-training time per task) × Number of employees × Task frequency.
- Average Hourly Value = Fully loaded cost per FTE ÷ annual working hours.
- Total AI Training Costs = all training, tooling, and support costs.
Example:
- 30 analysts each spend 4 hours/week on reporting before AI; 2 hours after training.
- Time saved = 2 hours/week × 48 weeks × 30 analysts = 2,880 hours/year.
- Average hourly value = $80. Value of time saved = 2,880 × $80 = $230,400.
- Total AI training and tooling costs = $90,000.
- ROI = (230,400 ÷ 90,000) × 100 ≈ 256%.
Even if headcount stays the same, I can frame this as a pool of time that leaders can reinvest into higher-value work.
Hard ROI Vs Soft And Strategic Value
When I report ROI for AI training, I have learned to carefully separate hard and soft value.
- Hard ROI: labor hours saved, output increases, reduced vendor spend, avoided compliance or error costs with a clear price tag. These go into the formulas.
- Soft and strategic value: faster experimentation, better decision quality, cultural adoption of AI, employer brand, and resilience.
I still describe the soft side and, where possible, give directional estimates, yet I keep it distinct from the hard ROI figure. This way, finance teams can trust that I am not inflating the case, while senior leaders see the full picture.
How Productivity Becomes The Central Metric For AI Training ROI
The more I work on measuring ROI of AI training, the more I see productivity as the central thread. Experts across AI and data training agree: the clearest sign of return is higher output and quality per unit of labor. When AI skills spread, people do more valuable work with less manual effort, and they do it faster.
That said, the data takes time to stabilize. For the first few months, productivity often spikes right after training, then dips as people adjust workflows, then climbs again as they refine how they use AI. Real trends often emerge between 12 and 24 months. During that time, organizational choices decide whether any saved hours become real value or disappear. If leaders do not change goals, project plans, and priorities, the time that AI frees up drifts into more meetings and email, not more revenue or better service.
When I quantify productivity, I rarely rely on a single metric. I choose units of output that make sense for each function—tickets resolved in customer service, campaigns shipped in marketing, features delivered in engineering, cases processed in operations. I control for seasonality and volume shifts, then compare baseline output per FTE with post-training figures. Around that, I layer qualitative checks and leadership coaching so that teams know how to put those gains to work.
Practical Ways To Quantify Productivity Gains
In practice, I use a few straightforward methods that HR, L&D, and operations leaders can apply without heavy analytics teams:
- Labor Cost Versus Output Comparison
- Define a clear unit of work (tickets, reports, analyses, lines of code merged).
- Measure output per person in a stable period before training.
- Measure the same after training, adjusting for demand or staffing changes.
- The difference gives a clean productivity lift percentage.
- Workflow Automation Impact
- Map the main tasks in a process.
- Estimate or measure time per task before AI and after AI-supported workflows.
- Multiply time saved per task × frequency × number of employees.
- Convert annual hours saved into monetary value using fully loaded hourly cost.
- Error And Rework Reduction
- Track defect rates, compliance issues, and rework hours.
- Treat avoided rework as “negative cost” recovered and include it in ROI.
- Decision-Cycle Time
- For leaders and knowledge workers, measure time to gather data, run scenarios, and decide.
- Faster cycles mean more responsive operations and better customer outcomes.
A classic case: an operations team cuts monthly reporting time from five days to three after AI training, freeing two days each month for higher-impact work.
Making Productivity Gains Show Up In Financial Results
One of the biggest traps I see is treating estimated time savings as if they automatically drop to the bottom line. In reality, freed time only turns into financial value when managers use it deliberately. If there is no change in targets, backlogs, or expectations, the organization just has people moving a bit faster with no clear business gain.
To avoid this, I work with leaders to reassign saved time to higher-value activities. That might mean:
- Launching more experiments or campaigns.
- Spending more time with customers.
- Writing more proposals or improving quality of service.
- Reducing external contractor spend by doing more internally.
Leaders need to adjust goals and capacity planning to reflect new productivity baselines instead of quietly enjoying “slack.”
This is where leadership coaching becomes a critical part of measuring ROI of AI training. With tools like iAvva AI Coach, managers get daily prompts that push them to think about how they use AI, how they redeploy time, and how they set new norms. When leaders reflect on these choices and align them with OKRs, time savings are much more likely to show up as real improvements in revenue, service, or cost.
Tailoring ROI Measurement To Different Types Of AI Training
AI training is not a single thing, so its ROI does not show up in a single way. When I lump generative AI, automation skills, and foundational literacy together, I miss important differences. Each type of capability creates value through a distinct set of levers, and my measurement needs to match.
- For generative AI, gains show up in content and knowledge work—drafting, summarizing, translating, and coding.
- For agentic and automation-oriented skills, value is in multi-step workflow automation and AI-assisted decisions.
- For foundational AI literacy and leadership, the impact is wider and more indirect: adoption across the company, innovation pipeline growth, and reduced risk.
In many organizations, programs mix these types. A leadership cohort might learn basic AI concepts, generative prompts, and how to sponsor automation projects. In that case, I build a portfolio of metrics—some at the content level, some at the process level, and some at the adoption and culture level—then track them across the 3×3 architecture.
ROI For Generative AI Skills (Content, Communication, Code)
When I train teams on generative AI, I usually start with prompting for drafting and editing emails, documents, code, and presentations. People learn how to decompose tasks, give context, and review AI output. The value shows up in how fast they can create and improve content, how often they need revisions, and how many variations they can test.
Key levers include:
- Content creation speed and volume.
- Fewer revision cycles.
- More experimentation with assets and messages.
Example:
- Marketing team used to produce 60 assets per quarter, at 6 hours each = 360 hours.
- After training, they produce 90 assets, at 4 hours each = 360 hours.
- Same hours, 50% more output.
If engagement or conversion rates also rise from the extra campaigns, the revenue impact grows further.
Metrics to track:
- Assets produced per period.
- Average hours per deliverable.
- Internal approval times.
- Performance metrics: open rates, CTR, conversion rates, pipeline created.
For engineers using generative AI for code and documentation, I look at:
- Cycle times (idea to merged code).
- Lines of code merged per sprint.
- Defect and rollback rates.
These numbers feed directly into productivity-based ROI models with a clear story about both volume and quality.
ROI For Agentic And Automation-Oriented AI Skills
Agentic AI training teaches people how to design, monitor, and improve AI-driven workflows. That includes triage bots, data collection agents, and automated routing or approvals. Here, value comes from:
- Process automation coverage.
- Throughput per head.
- Shorter cycle times.
- More consistent decisions with fewer mistakes.
Customer support example:
- Before training, agents manually read, classify, and respond to every ticket.
- After training and deployment, an AI system categorizes tickets, suggests responses, and flags complex cases.
- Each agent handles, say, 25% more tickets per day with equal or better CSAT.
If a 40‑person team moves from 40 to 50 tickets per person per day, across 240 days, that is an extra 96,000 tickets per year. I can:
- Multiply by an internal value per ticket; or
- Show that we absorbed growth without adding headcount.
Metrics:
- Tickets per agent per day.
- Average handling time (AHT).
- First-contact resolution (FCR).
- CSAT and NPS.
- Misclassification rates.
Program costs include AI tooling, integration, and training time. The difference between baseline and post-implementation performance gives a clear automation ROI story.
ROI For Foundational AI Literacy And Leadership Development
Foundational AI literacy and leadership programs reach a broader group of employees and leaders. The focus is on understanding AI concepts, ethics, governance, and how to spot good use cases. For leaders, it also covers change management, psychological safety, and how to guide teams through AI adoption.
Value often appears as:
- Increased cross-functional adoption of AI.
- A stronger innovation pipeline of AI use cases.
- Lower risk from misuse or shadow AI.
Example:
- After a literacy program, 15 new AI-enabled workflows are proposed in six months.
- Each one is validated to save 300 hours/year.
- 15 × 300 = 4,500 hours saved annually.
- At $60/hour, that equals $270,000 in value.
- Program cost = $90,000 → ~200% hard ROI even before secondary effects.
Leadership development multiplies that effect. When leaders frame AI as a tool for better work, not a threat, adoption rises. Tools like iAvva AI Coach help by tying daily reflections to OKRs and tracking shifts in focus, self-awareness, and productivity. Over time, I can correlate these behavioral trends with team metrics like throughput, engagement, and turnover.
Key Metrics And KPIs To Track When Measuring ROI Of AI Training
To build dashboards that matter, I group metrics into three buckets that align with the 3×3 framework:
- Leading indicators.
- Operational metrics.
- Strategic outcomes.
Within each bucket, I choose KPIs that map cleanly to business value and are practical to collect.
Typical patterns by function:
- Sales – activities per rep, conversion rates, revenue per seller.
- Customer Service – tickets per agent, AHT, CSAT.
- Engineering – cycle times, features released, defect rates.
- HR – time-to-fill, onboarding speed, internal mobility.
Each metric tells a story about how AI training changed work, not just learning.
Leading Indicators (0–6 Months): Adoption And Behavior Change
In the first few months after AI training, the most realistic story sits in leading indicators. Helpful KPIs include:
- AI tool adoption velocity – percentage of trained users active weekly; time to first meaningful AI-assisted task.
- Time-to-proficiency – days until someone can reliably draft a high-quality prompt or build a basic AI workflow without support.
- Cross-functional collaboration – number of joint AI projects, participation in AI communities of practice, ideas submitted to AI challenges.
- Leadership engagement – percentage of managers completing AI literacy modules; number of teams adopting explicit norms on AI use.
With iAvva AI, I can go deeper and look at:
- Frequency of daily reflections about AI use.
- Length of reflection streaks.
- Trends in self-reported focus, productivity, and stress.
These patterns give me early indicators of behavior change that often predict later performance shifts.
Operational Efficiency Metrics (6–18 Months)
As AI training settles in, I move to hard operational numbers.
Key KPIs:
- Productivity and throughput – output per FTE or per team, using relevant units (tickets, campaigns, code merges, cases).
- Cycle time – time-to-resolution, time-to-close, time-to-offer, time-to-publish.
- Automation rates – percentage of eligible tasks supported or executed by AI; share of AI-assisted vs manual work.
- Error and rework – defect rates, compliance errors, number of corrections, and hours spent fixing issues.
- Embedded usage – frequency of AI tool use inside core systems (CRM, ticketing, code repositories).
These operational KPIs are concrete enough to feed into ROI calculations that finance teams respect.
Business And Strategic Outcomes (12–36 Months)
Over longer periods, my attention shifts to board-level outcomes:
- Revenue – changes in conversion rates, deal size, upsell/cross-sell performance connected to AI insights or faster follow-up.
- Innovation and speed – time-to-market for products or features; number of AI-enabled experiments per quarter.
- Customer outcomes – CSAT, NPS, churn, response and resolution times.
- Talent and culture – retention in AI-intensive teams, internal mobility into AI roles, engagement scores on learning and technology items.
When I see teams with strong AI leadership development maintain higher engagement and lower burnout as they automate routine work, I can talk about AI training as a driver of long-term resilience, not just efficiency.
Using AI Itself To Measure The ROI Of AI Training
One of the most powerful shifts I have seen is using AI to measure AI training. Instead of hand-assembled spreadsheets, AI platforms can connect learning data, usage patterns, and operational performance to surface insights that would be easy to miss. This is where systems like iAvva AI become more than content delivery tools—they act as analytics engines tied to leadership development.
By integrating coaching apps, LMS data, and operational systems, I can watch how behavior and output move together over time. AI models can flag which teams show the biggest gains after training, which skills lag, and where adoption stalls. They can also summarize large volumes of feedback, pointing me to what learners need next.
“Without data, you’re just another person with an opinion.” – W. Edwards Deming
This kind of automated, continuous analysis makes measuring ROI of AI training faster, more accurate, and more actionable.
AI-Enabled Performance Analytics
To build AI-enabled analytics, I start by connecting key systems:
- The learning platform.
- Coaching tools like iAvva AI Coach.
- Operational systems such as CRM, service desks, ERP, or code repositories.
Once the data flows, AI models can:
- Scan trends in output per person, defect rates, and cycle times before and after training.
- Surface patterns that averages might hide (for example, one region’s sales reps increased both call volume and conversion, another only volume).
- Reveal whether teams with higher engagement in AI coaching see bigger gains in focus and productivity.
These insights let HR and L&D target their efforts:
- Identify “super users” and invite them to mentor others.
- Flag teams without gains and investigate whether they need different training, better tools, or stronger leadership support.
Instead of guessing where ROI is strongest, I have evidence.
AI-Powered Assessments And Skills Mapping
Traditional multiple-choice tests do not say much about real AI capability. AI-powered assessments let me evaluate work that looks more like the job:
- AI-augmented emails, prompts, workflows, or code samples.
- Scored by AI against clear rubrics for quality, compliance, and risk.
Over time, I track:
- How scores change by individual and cohort.
- Who progresses from basic to advanced prompting.
- Who can design safe automations and who still struggles with verification.
When I match these assessment trends with performance outcomes, I can define what “proficient” looks like for each role and how long it takes to get there—making both training design and ROI arguments more concrete.
Continuous Feedback And Program Optimization
AI also helps me keep the program fresh. By mining:
- Survey comments.
- Chat logs.
- Forum posts and open-text feedback.
AI can group themes about what is working, where workflows feel clunky, or where people feel unsure about policy. Instead of reading thousands of lines of text, I get clear clusters and examples.
I use those insights to:
- Update content.
- Adjust governance rules.
- Tune support and office hours.
AI can even push micro-learning or reminders when it detects common gaps—for example, sending a short prompt practice or ethics reminder to groups that show risky usage patterns. With iAvva AI, daily coaching prompts can be adapted based on real behavior and feedback. This tight loop—data to insight to adjusted training—steadily improves both impact and ROI.
Designing AI Training With ROI In Mind From Day One
The easiest way to fail at measuring ROI of AI training is to design the program first and worry about metrics later. I have made that mistake before. The better path is to design training to be measurable from the start. That means anchoring on business outcomes, involving the right stakeholders, embedding learning in real work, and planning baselines before the first session runs.
When I start this way, every module has a reason to exist. Every exercise links to a workflow we care about. Every leader involved knows which KPIs to watch. Over time, this approach turns AI training into a repeatable business tool, not a one-off experiment.
Start From Business Problems, Not AI Tools
My first step is always to name a short list of business outcomes that matter, such as:
- Cut average customer response time by 30%.
- Halve monthly reporting time.
- Double content throughput without adding headcount.
With that list, I map each outcome to specific roles, workflows, and AI capabilities. A simple table works well:
- Column 1 – Target business outcome.
- Column 2 – Key workflow(s).
- Column 3 – AI capability needed (summarization, triage, code generation, etc.).
- Column 4 – Training modules and support required.
Example mapping:
- Outcome: reduce reporting time by 50%.
- Workflow: finance month-end close.
- AI capability: document summarization and data checks.
- Training: two focused sessions plus job aids and prompts.
With that clarity, later ROI attribution is far easier. If month-end close moves from ten days to six after the program, I can tell a convincing story about the role of AI skills, along with tools and process changes.
Co-Design With Stakeholders And Bake In Measurement
Co-designing with line leaders, Finance, IT, and HR saves time later. Together, we:
- Define success metrics and baselines.
- Pick real use cases to feature.
- Agree on data sources and access.
Sales helps decide which conversion or activity metrics matter. Ops highlights where process mining is possible. IT explains which AI usage logs we can pull. Finance helps set ROI targets and validates formulas.
Before launch, I also:
- Schedule 3‑, 6‑, 12‑, and 24‑month reviews.
- Assign ownership: HR/L&D for learning data, line leaders for performance, IT for tool adoption and safety.
- Use a pre-launch checklist for baselines, system access, and analysis roles.
That discipline pays off when the CFO asks for a summary one year in.
Embed Learning In The Flow Of Work
When training happens only in a classroom or portal, behavior change is weak and hard to measure. So I look for ways to embed learning into real work:
- Use the actual tools, data, and scenarios people handle every day.
- Design micro-learning and prompts that appear at natural moments in workflow.
Examples:
- AI practice tasks inside CRM or ticketing, nudging reps to use AI for call preparation or case summaries.
- Onboarding flows that incorporate AI from week one, with time-to-proficiency and quality tracked against earlier cohorts.
- With iAvva AI, leaders receive five-minute daily prompts to reflect on how they used AI, what decisions they made faster, and how they delegated differently.
One of the best use cases is onboarding. If new hires start using AI to complete real tasks in their first week, and I track ramp-up speed and quality versus previous cohorts, I get hard numbers—like a 25% reduction in time-to-productivity.
How iAvva AI Makes Measuring ROI Of AI Training Easier (And More Credible)
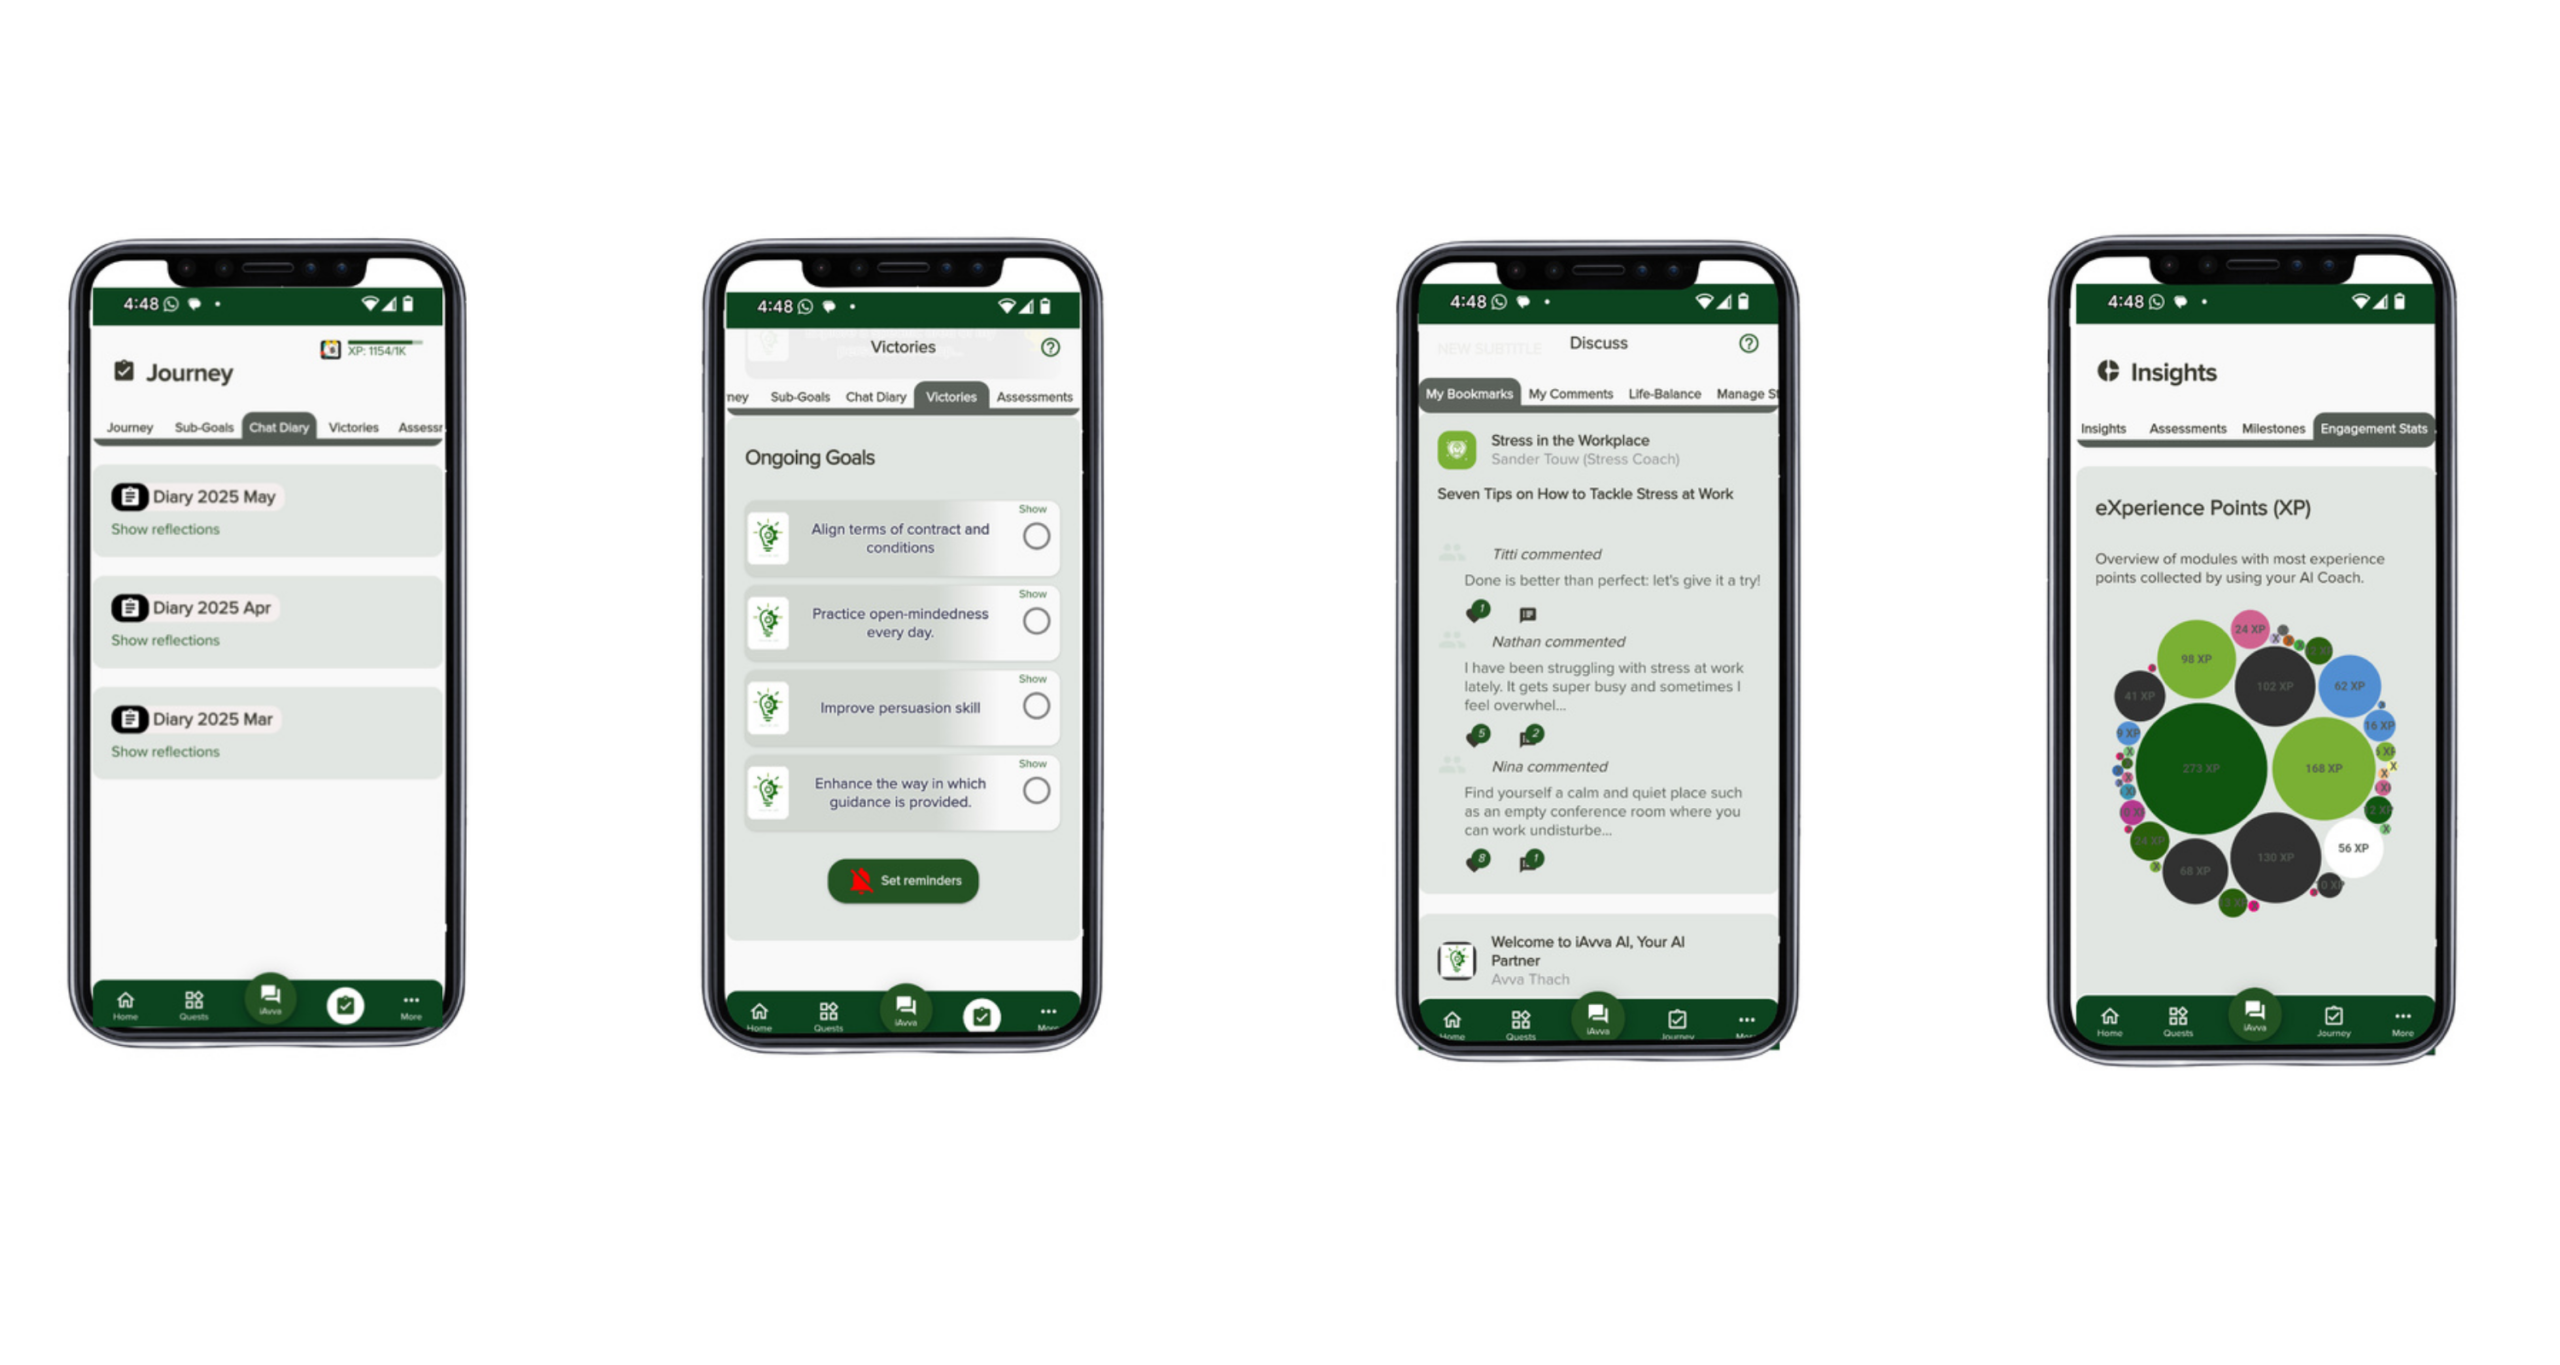
When I look at the gap between classic leadership training and what AI-driven organizations need, iAvva AI stands out because it was built with measurement in mind. Instead of just delivering content, it works as a five-minute-a-day AI leadership coach that ties personal growth to business goals and produces real-time analytics for People teams.
The app draws on neuroscience, positive psychology, and ICF coaching principles to encourage short, focused reflections. Leaders talk into or type into the app, exploring decisions, priorities, and how they use AI in their role. Over time, this builds habits around ethical, effective leadership—and a rich stream of behavior data that can be correlated with KPIs. Early users report higher focus, greater self-awareness, and better productivity, which are exactly the leading indicators I want to see in AI-heavy environments.
Because iAvva AI runs on Web, iOS, and Android in 19 languages and supports both audio and text, it works for distributed and neurodiverse teams at scale. That reach and flexibility make it a powerful multiplier for AI training ROI, especially in SMBs and enterprises that need to shift culture without sending every leader to expensive, one-off workshops.
Strategic Alignment: From Leadership Reflection To Business OKRs
One of the hardest parts of measuring ROI of AI training is linking leadership behavior to business objectives. iAvva AI builds that bridge by letting leaders set personal growth goals that tie directly to organizational OKRs. For example, a leader can connect a goal like “use AI to cut report prep time by 30%” to a team-level OKR around faster decision-making.
Daily prompts guide leaders to reflect on:
- How they spent their time.
- Which decisions they made and how AI helped.
- How they delegated and coached others around AI.
Over weeks, this creates a trace of behavior: how often they used AI as a co‑pilot, how they handled resistance, and how clearly they connected AI use to team goals.
On the backend, analytics roll these reflections up into trend data on focus, accountability, and AI-related habits. When I cross-reference that with team metrics such as throughput, engagement, or error rates, I can tell a stronger story—for example, that teams whose leaders consistently reflect on AI usage through iAvva AI show faster improvements in cycle times or engagement.
Real-Time Analytics And Dashboards For HR, L&D, And The C‑Suite
From a People and analytics perspective, iAvva AI operates like a live sensor network for leadership growth:
- Dashboards show coaching engagement rates, reflection streaks, and changes in self-reported focus, productivity, and stress.
- HR and L&D can see which departments or regions lean into AI-related reflection and which remain quiet.
I use these data as leading indicators of behavior change. For example:
- A rise in focus and lower stress in AI-intensive teams, with stable or rising output, suggests training and coaching design is working.
- Low engagement and flat performance in another area signal a need for extra support.
When I combine these insights with system-level KPIs from CRM, HRIS, or ERP, I can create unified ROI views. While correlation does not prove causation, recognizable patterns strengthen my case for what works.
Scalability, Inclusivity, And Cost Efficiency As ROI Multipliers
ROI is not only about impact per person; it is also about how far and how affordably I can spread that impact. iAvva AI helps by offering:
- Multi-platform access (Web, iOS, Android) and 19 languages, supporting global teams.
- Audio and text modes, which aid accessibility and different learning preferences.
- A five-minute daily format, raising weekly engagement without blocking calendars.
Higher sustained engagement plus low marginal cost per additional user creates a favorable cost profile. Compared to flying leaders into in-person workshops, the per-leader cost of impact often looks much better—showing up clearly in training ROI calculations.
A Practical Roadmap For Measuring ROI Of AI Training In Your Organization
Knowing what to measure is one thing; rolling it out inside a real company is another. I have found that a phased roadmap works best, especially for SMBs and enterprises in the middle of digital change. The idea is to start small, learn fast, and build trust with evidence before scaling.
I usually break the plan into three phases:
- Phase 1 (0–3 months) – baseline and pilot.
- Phase 2 (3–12 months) – operationalization and scaling.
- Phase 3 (12–36 months) – enterprise integration and strategic value.
Throughout, I look for places to bring in iAvva AI as the leadership and measurement layer.
Phase 1 (0–3 Months): Baseline And Pilot
In Phase 1, I pick one to three high-impact workflows where AI skills could make a visible difference—such as:
- Customer ticket handling.
- Sales outreach.
- Month-end reporting.
- Recruiting and screening.
Steps:
- Select Pilot Teams
- Choose a few teams with clear workflows and supportive leaders.
- Capture Baseline Data
- Productivity, error rates, cycle times, simple revenue proxies.
- 3–12 months of history if possible.
- Design Targeted Training
- Focus on real workflows rather than generic AI theory.
- Combine generative skills, automation basics, and clear guardrails.
- Onboard Leaders To iAvva AI
- Encourage daily reflection on AI usage, prioritization, and team coaching.
- Define Measurement Plan
- List metrics, systems, data owners, and review cadence.
This clarity at the start makes scaling in Phase 2 much smoother.
Phase 2 (3–12 Months): Operationalization And Scaling
As pilot data comes in, I:
- Compare outcomes against baselines and initial targets.
- Ask what worked and what did not, including learner and leader feedback.
- Adjust training content, AI tool configuration, and leadership support.
With an evidence base, I then:
- Roll out to similar teams or regions.
- Standardize AI-enabled SOPs so successful workflows become the new norm.
- Embed AI metrics into operational dashboards, not just L&D reports.
Throughout Phase 2, iAvva AI analytics help me spot where leadership engagement is boosting or blocking ROI. If one group’s leaders show high engagement with the Coach app and strong performance gains, while another lags on both fronts, I know where to focus support.
Phase 3 (12–36 Months): Enterprise Integration And Strategic Value
In Phase 3, AI training becomes part of how the organization grows leaders and teams:
- Integrate AI literacy and leadership into talent and succession planning.
- Create organization-wide AI capability benchmarks by function and role.
- Add AI usage and leadership behavior into performance and development conversations.
Multi-year ROI models now link AI training to:
- Innovation rates.
- Revenue patterns.
- Risk trends.
- Workforce resilience and retention.
At this stage, I can tell stories such as:
- “Over three years, teams with high AI leadership engagement have 15% higher retention and 20% faster product release cycles.”
iAvva AI acts as a kind of nervous system through this phase. Daily reflections and analytics keep leaders tuned to how they use AI and how their choices affect teams. For HR and the C‑suite, the platform’s data provides a living picture of leadership culture in an AI-powered company.
Conclusion
As I step back, the core lesson on measuring ROI of AI training is clear. It is not a story about course completions or test scores; it is a story about productivity, workflow redesign, and how leaders choose to use AI. When I combine those elements with a 3×3 architecture—time horizons crossed with measurement layers—I gain a practical blueprint that finance and the board can understand.
Different AI capabilities demand different metrics. Generative AI asks me to track content speed, volume, and quality. Agentic and automation skills point toward throughput, cycle time, and error rates. Foundational literacy and leadership push me to watch adoption, innovation, and risk. Across all three, AI itself can help by analyzing performance data and learning feedback, turning scattered signals into coherent ROI insights.
Platforms like iAvva AI make this easier by tying leadership reflection directly to OKRs and producing real-time, human-centered analytics. When leaders build daily habits around AI use, focus, and decision-making, the time savings unlocked by AI training are far more likely to show up as higher-value work, not wasted slack.
If I were starting fresh, I would:
- Pick one or two high-impact workflows.
- Gather 3–12 months of baseline data.
- Design a focused AI and leadership pilot.
- Choose a small set of KPIs to track before and after.
- Equip pilot leaders with an AI coach like iAvva AI to help them turn new capability into new norms.
From there, I would scale what works, keep the measurement honest, and use the resulting story to keep the C‑suite invested. In a world where AI budgets will keep growing, being able to prove the return on training is no longer optional—it is a core leadership skill.
FAQs
Question: What Is The Best Way To Start Measuring ROI Of AI Training If We Have Never Done It Before?
I begin small and concrete. I choose one or two workflows where AI can clearly save time or reduce errors, such as reporting or customer response. I collect 3–12 months of baseline data on output, cycle time, and mistakes. Then I design targeted AI training plus leadership support around those workflows. I select three to five KPIs—like hours per task, cases per agent, or error rates—and track them before and after training. I use a straightforward productivity-based ROI formula that converts hours saved into dollar value, then refine my approach as more data comes in.
Question: How Long Does It Take To See Measurable ROI From AI Training?
Early signals show up quite fast. Within the first 0–3 months, I can see adoption, proficiency, and behavior shifts, especially if I track tool usage and reflection patterns. Operational efficiency gains, like reduced cycle times and fewer errors, usually appear between 6 and 18 months as new workflows settle in. The biggest strategic outcomes—revenue changes, innovation speed, market effects—tend to require 12–36 months of consistent effort. Staged reporting at these intervals helps keep executive sponsorship strong.
Question: How Do We Separate The Impact Of AI Training From The Impact Of AI Tools Themselves?
To separate training and tools, I look for comparison groups and time windows. In some cases, one group gets the tools and training, while another similar group gets the tools but lighter training. I compare performance across them. In other cases, I track performance before any AI tools, after tools but before structured training, and finally after both tools and training are in place. This helps show how much value was unlocked once people knew how to use the tools well. I still describe training as a capability enabler rather than the only cause, but I can speak more concretely about its contribution.
Question: Can We Really Measure “Soft” Leadership Outcomes Like Self-Awareness Or Focus In An ROI Model?
I think we can, as long as we stay honest about what the numbers mean. I use validated surveys and self-report scales to track changes in self-awareness, focus, and stress over time. With platforms like iAvva AI, I also see patterns in reflection frequency and themes, which offer another view into leadership habits. Then I connect these soft indicators to hard outcomes such as turnover rates, absenteeism, and productivity. I do not force them into precise dollar values, but I present them as supporting evidence that helps explain why some teams deliver stronger ROI from AI training than others.
Question: How Does A Platform Like iAvva AI Help Us Build A Stronger Business Case For AI Training?
iAvva AI strengthens the business case in two main ways. First, it links individual leadership goals directly to organizational OKRs, so every reflection and habit is tied to a business outcome. Second, it generates real-time analytics on engagement, focus, self-awareness, and productivity signals across leaders. Daily micro-reflections keep behavior change alive long after workshops end, which increases the odds that AI training turns into real workflow shifts. HR and L&D can then combine iAvva AI data with operational KPIs to tell a clear, data-backed ROI story to the C‑suite and board, making future investments easier to secure.


Leave a Reply